Who this is for: service delivery managers, transition managers, anyone who needs the view across projects rather than within one.
Open the Apps menu in Jira’s top navigation and choose Transition Portfolio.
(Do not look for “Service Transition & Readiness” here — that is the name of the project page and the admin page.)
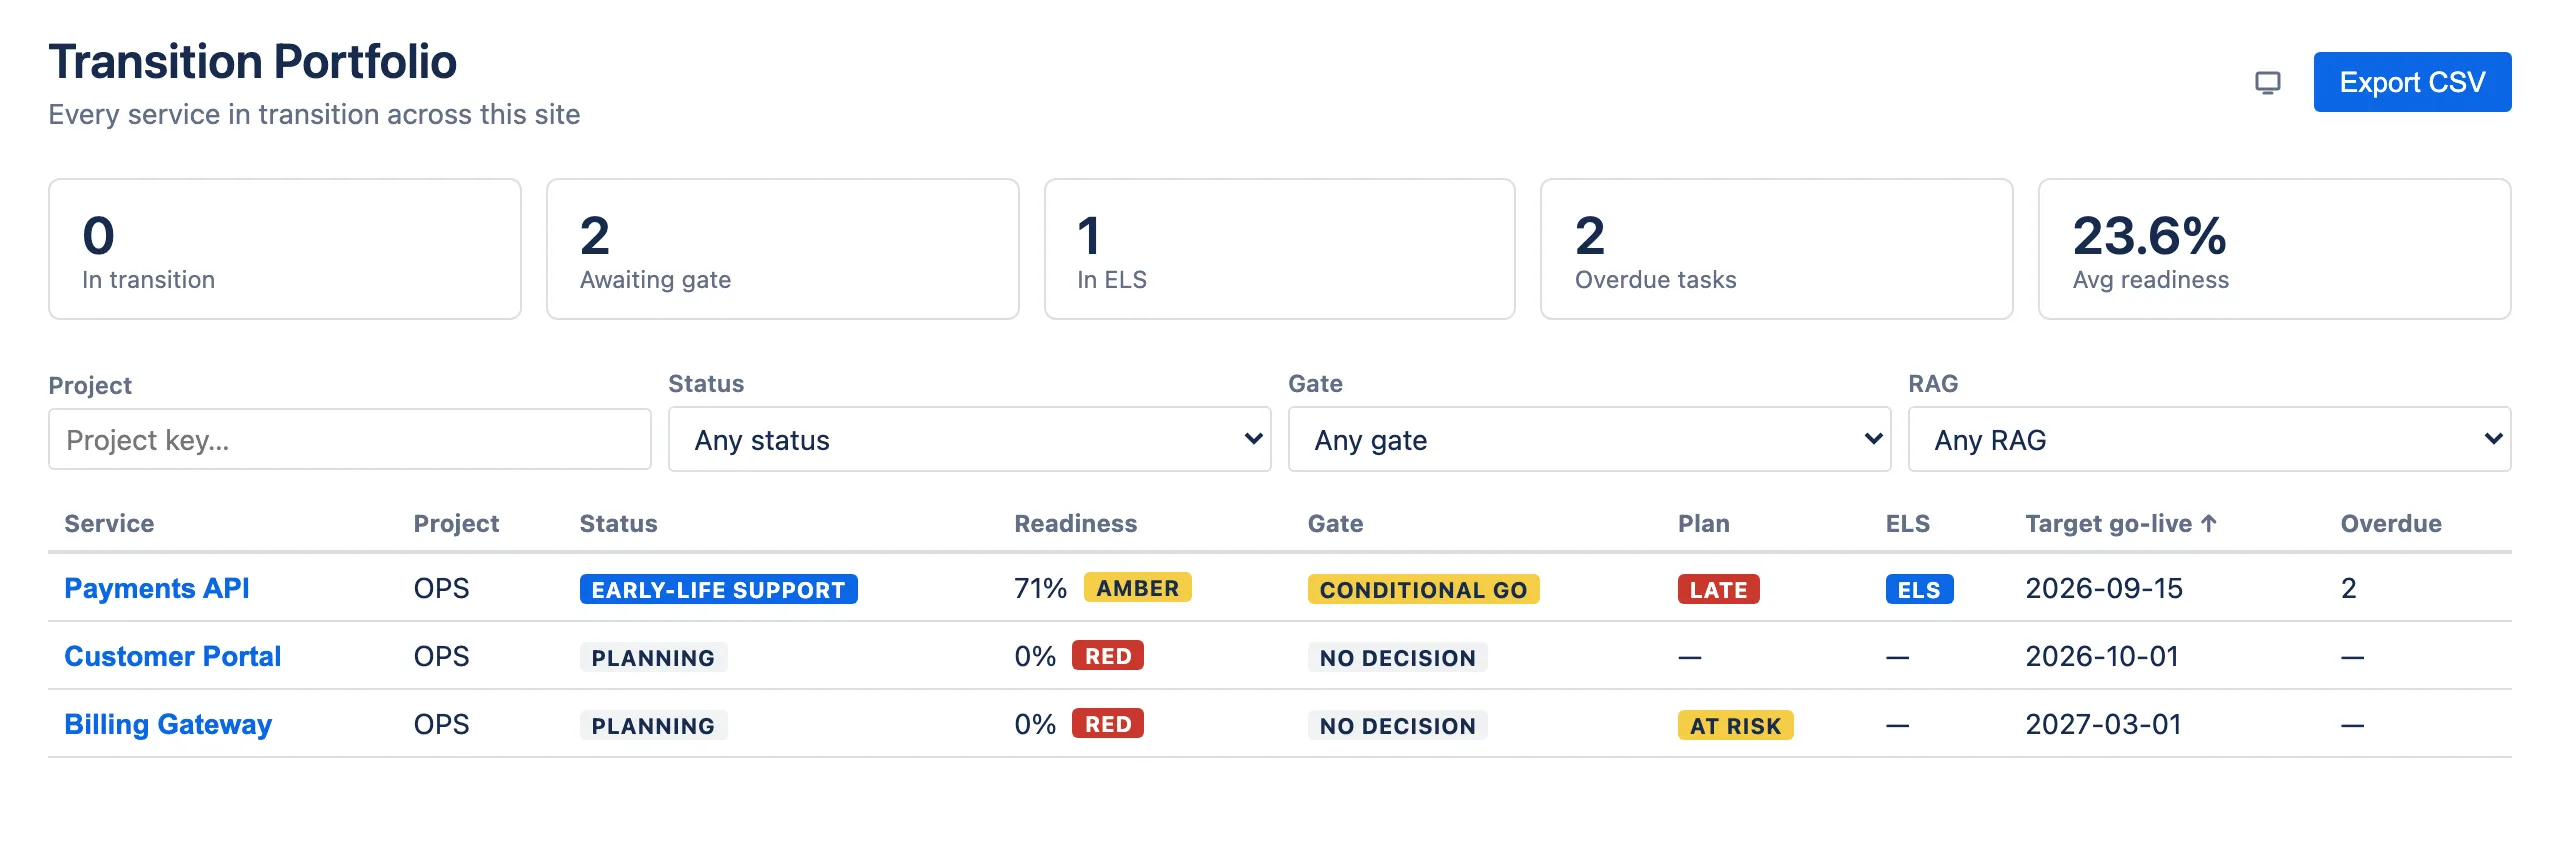
Where the Transition Hub shows one project, the portfolio shows every service across the whole site.
The tiles
| Tile | Counts |
|---|---|
| In transition | Services with status In transition. |
| Awaiting gate | Services in Planning or In transition with no gate decision. A service that reached ELS or Live without a gate is not counted. |
| In ELS | Services in early-life support. |
| Overdue tasks | Total overdue plan tasks across every service shown, archived included. |
| Avg readiness | Mean readiness score across the non-archived services shown. Filter to Status = Archived and this reads 0%. |
The tiles reflect the currently filtered set, not the whole site. Filter to one project and the tiles describe that project.
Note the Awaiting gate definition: it is deliberately scoped to services still before go-live, so it will not flag a service that slipped into ELS without a recorded decision. Use the Gate filter set to No decision to find those.
Filtering
Four filters, all combinable:
| Filter | Notes |
|---|---|
| Project | A Jira project key such as OPS. |
| Status | Planning, In transition, Early-life support, Live, Archived. |
| Gate | No decision, Go, Conditional Go, No-Go. |
| RAG | Red, Amber, Green — on the readiness score. |
Archived services are hidden by default. Set Status to Archived to list them.
Clear filters appears once any filter is set. When there are no rows to show — whether because the filters exclude everything or because the site has no services yet — the table reads “No services match the current filters.”
On large sites
The portfolio reads up to 500 services per view. Project and Status are applied while reading, so they genuinely narrow the set. Gate and RAG are applied afterwards, to whatever the first 500 rows were — so on a site near the cap, filtering by gate or RAG narrows an already-truncated list. Filter by project first.
Sorting
Readiness and Target go-live are sortable — click the header to sort, click again to reverse. An arrow shows the current direction. The default is target go-live, soonest first. No other column sorts.
Reading the table
| Column | Meaning |
|---|---|
| Service | Click to jump to that service’s project — clicking anywhere in the row does the same, landing on its Transition Hub where you pick the service — it does not open the service directly. If the app cannot work out the link it falls back to the project’s issue browser instead. |
| Project | Which Jira project it belongs to. |
| Status | Where it is in the lifecycle. |
| Readiness | Weighted score and its RAG band. |
| Gate | The most recent gate decision. |
| Plan | Derived plan health. |
| ELS | Whether an ELS period is running. |
| Target go-live | The date. |
| Overdue | Overdue plan tasks for that service. |
You can list an archived service but not open one: the project hub excludes archived services from its list.
Combinations worth watching
- Green readiness, Late plan — the checklist says ready, the work says otherwise. Usually means the assessment has not been revisited recently.
- Conditional Go, ELS, overdue tasks — went live with conditions and the follow-up work is slipping. Open the gate history and check whether the conditions were ever met.
- Gate = No decision with a go-live date inside two weeks — nobody has decided yet and the date is close.
Exporting to CSV
Click Export CSV. The file downloads as
transition-portfolio-YYYY-MM-DD.csv.
It contains the currently filtered rows, always ordered by target go-live, soonest first. The column you sorted the table by does not carry into the file — so filter before exporting, but do not expect your sort to survive.
Export is not licence-gated: it works even while the read-only banner is showing.
What the columns look like
Ten columns, which is one more than the table: Readiness score and RAG are separate, where the table merges them into a single cell.
Values export as the app’s internal keys rather than the labels the table shows
— in-transition where the screen reads EARLY-LIFE SUPPORT-style lozenges,
conditional-go for CONDITIONAL GO, at-risk for AT RISK, and none for a
service with no gate decision. ELS exports yes/no. Map them if the file is
going in front of an audience.
Plan health and target go-live are left empty rather than keyed where a service has no plan or no date.
The file is RFC 4180 CSV — CRLF line endings, quotes doubled — and opens directly in Excel or Sheets.
Cells beginning with =, +, - or @ are prefixed with an apostrophe so
spreadsheets treat them as text rather than formulas. A service genuinely named
=Payments exports as '=Payments; strip the apostrophe if you need the raw
value.
Export is a point-in-time snapshot. There is no scheduled export.
The issue panel
Service Readiness is available on every Jira issue, but it is not shown by default: click the app’s button in the issue’s actions and the panel is added above the Activity section. It is not the collapsible right-hand panel.
On an issue with a service linked it shows:
- the service name
- Readiness N% with a RAG lozenge and a gate-decision lozenge
- a progress bar for the overall score
- a per-category score breakdown, once an assessment exists
- a Last gate line naming the decision, who made it and when, once one has been recorded
- an Open in Transition Hub button, which lands on the project’s apps list rather than on the service itself
A linked service with no assessment and no gate decision therefore shows the name, the score line, the bar and the button — nothing else. A service that has been archived is treated as unlinked, so the panel falls back to its empty state.
It is read-only, and says so with its own banner when the app licence is inactive. On an issue with nothing linked it says “No transition service is linked to this request yet.” and offers its own Open Transition Hub button — which goes to the Apps list, a different destination from the linked state’s button.
Because it has to be opened deliberately, treat it as something you point someone at, not as a passive readiness indicator on every ticket.
What the app does not do
Worth knowing so you do not look for it:
- No scheduled reports or email digests. Export when you need a snapshot.
- No cross-service dependencies. Services are independent.
- No time tracking or effort estimates on plan tasks.
- No custom columns on the portfolio.